 Получите свидетельство
 Вход
Вход


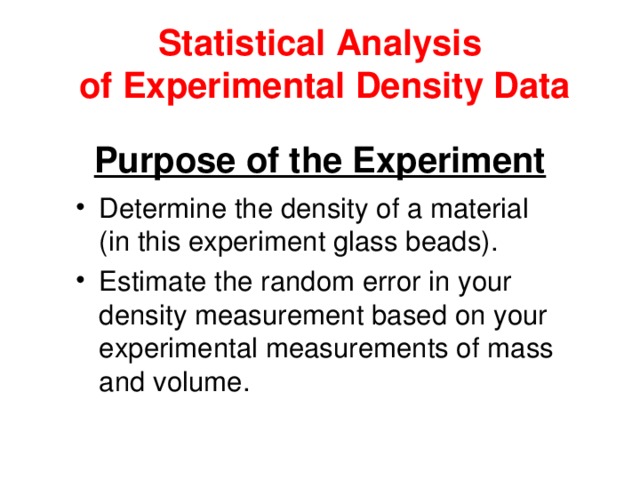
Statistical Analysis
of Experimental Density Data
Purpose of the Experiment
- Determine the density of a material (in this experiment glass beads).
- Estimate the random error in your density measurement based on your experimental measurements of mass and volume.
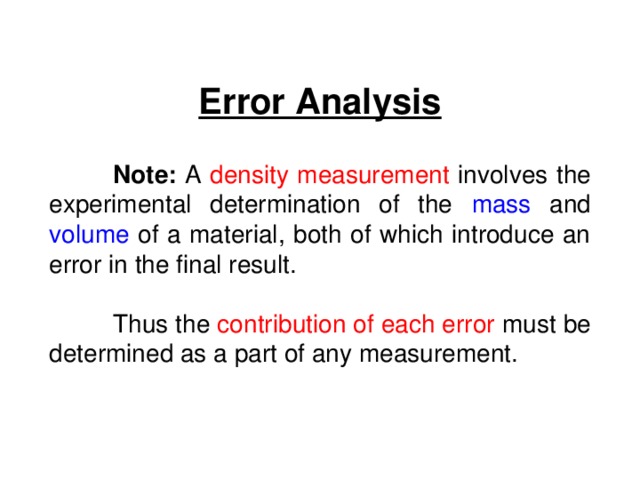
Error Analysis
Note: A density measurement involves the experimental determination of the mass and volume of a material, both of which introduce an error in the final result.
Thus the contribution of each error must be
determined as a part of any measurement.
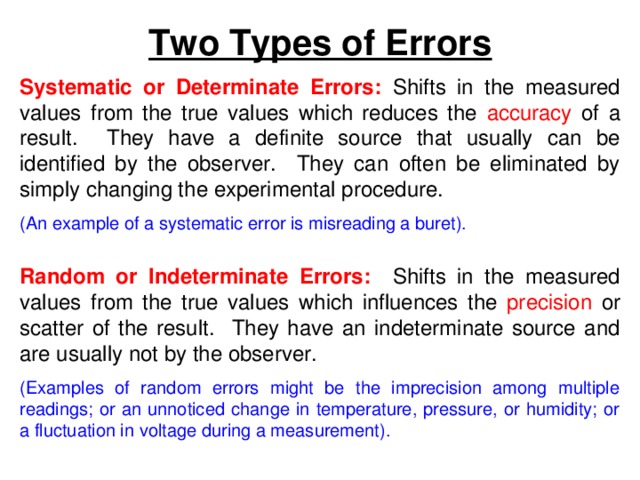
Two Types of Errors
Systematic or Determinate Errors: Shifts in the measured values from the true values which reduces the accuracy of a result. They have a definite source that usually can be identified by the observer. They can often be eliminated by simply changing the experimental procedure.
(An example of a systematic error is misreading a buret).
Random or Indeterminate Errors: Shifts in the measured values from the true values which influences the precision or scatter of the result. They have an indeterminate source and are usually not by the observer.
(Examples of random errors might be the imprecision among multiple readings; or an unnoticed change in temperature, pressure, or humidity; or a fluctuation in voltage during a measurement).
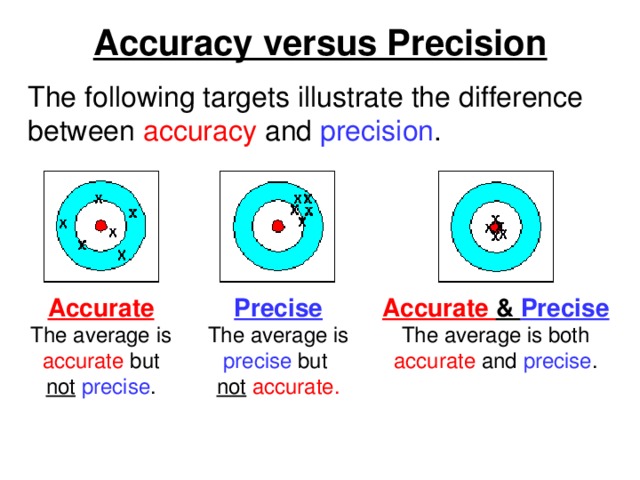
Accuracy versus Precision
The following targets illustrate the difference between accuracy and precision .
Accurate The average is accurate but not precise .
Precise The average is precise but
Accurate & Precise
not accurate.
The average is both accurate and precise .
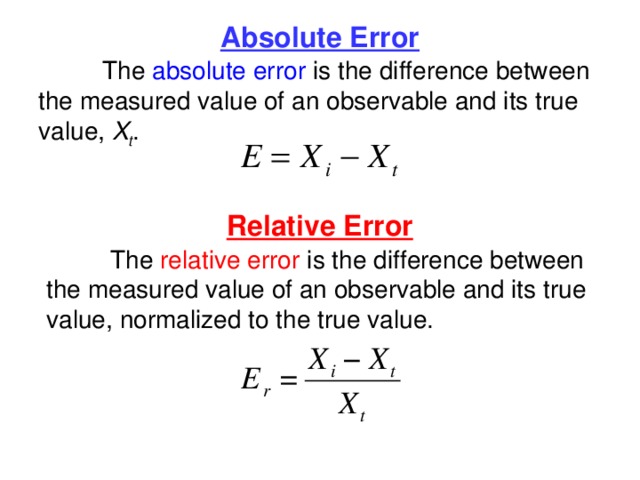
Absolute Error
The absolute error is the difference between the measured value of an observable and its true
value, X t .
Relative Error
The relative error is the difference between the measured value of an observable and its true value, normalized to the true value.
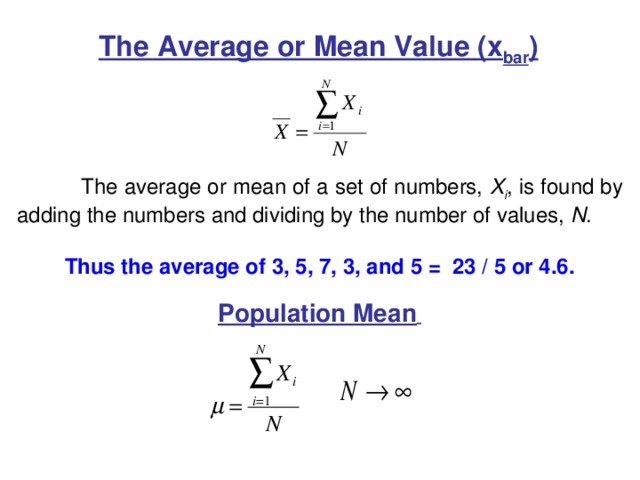
The Average or Mean Value (x bar )
The average or mean of a set of numbers, X i , is found by adding the numbers and dividing by the number of values, N .
Thus the average of 3, 5, 7, 3, and 5 = 23 / 5 or 4.6.
Population Mean
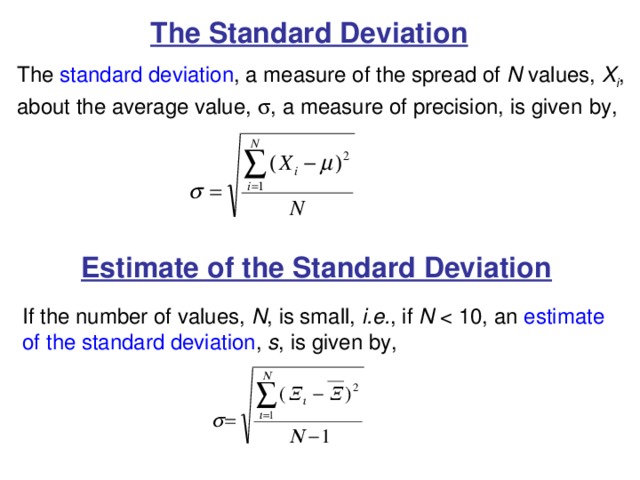
The Standard Deviation
The standard deviation , a measure of the spread of N values, X i ,
about the average value, , a measure of precision, is given by,
Estimate of the Standard Deviation
If the number of values, N , is small, i.e. , if N s , is given by,
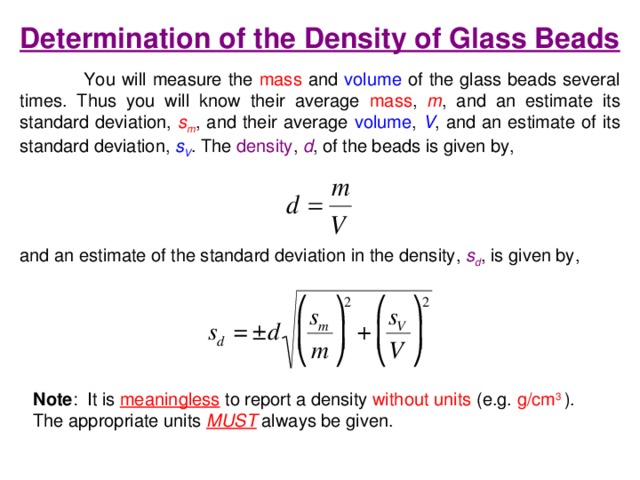
Determination of the Density of Glass Beads
You will measure the mass and volume of the glass beads several times. Thus you will know their average mass , m , and an estimate its standard deviation, s m , and their average volume , V , and an estimate of its standard deviation, s V . The density , d , of the beads is given by,
and an estimate of the standard deviation in the density, s d , is given by,
Note : It is meaningless to report a density without units (e.g. g/cm 3 ).
The appropriate units MUST always be given.
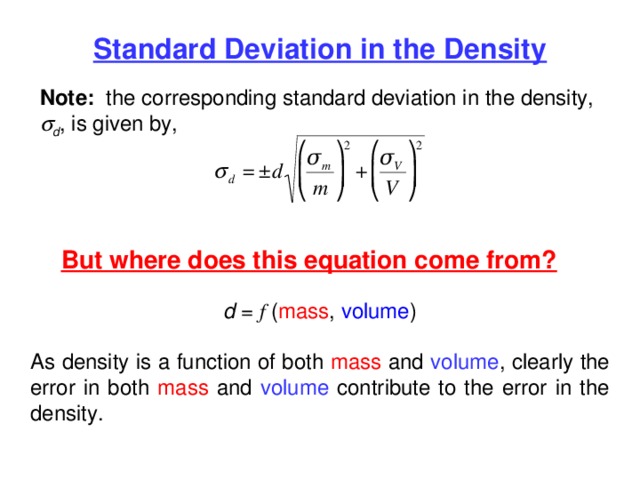
Standard Deviation in the Density
Note: the corresponding standard deviation in the density,
d , is given by,
But where does this equation come from?
d = f ( mass , volume )
As density is a function of both mass and volume , clearly the error in both mass and volume contribute to the error in the density.
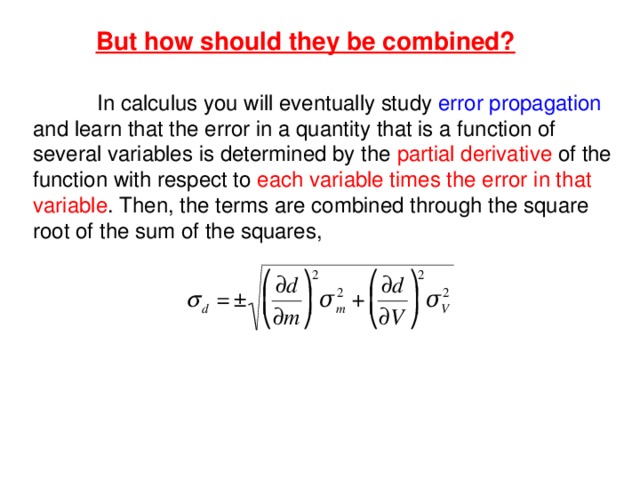
But how should they be combined?
In calculus you will eventually study error propagation and learn that the error in a quantity that is a function of several variables is determined by the partial derivative of the function with respect to each variable times the error in that variable . Then, the terms are combined through the square root of the sum of the squares,
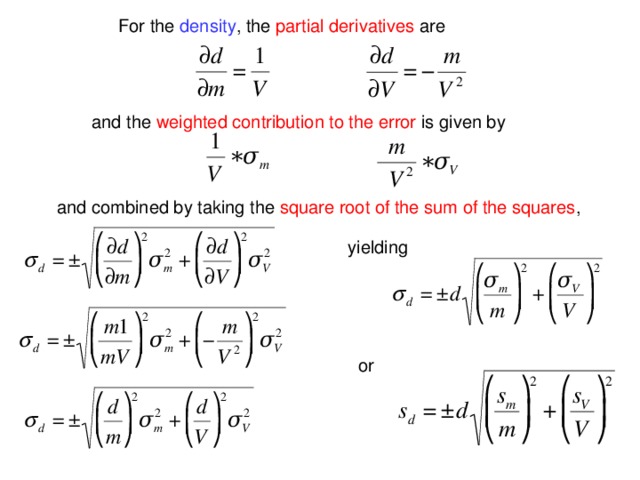
For the density , the partial derivatives are
and the weighted contribution to the error is given by
and combined by taking the square root of the sum of the squares ,
yielding
or
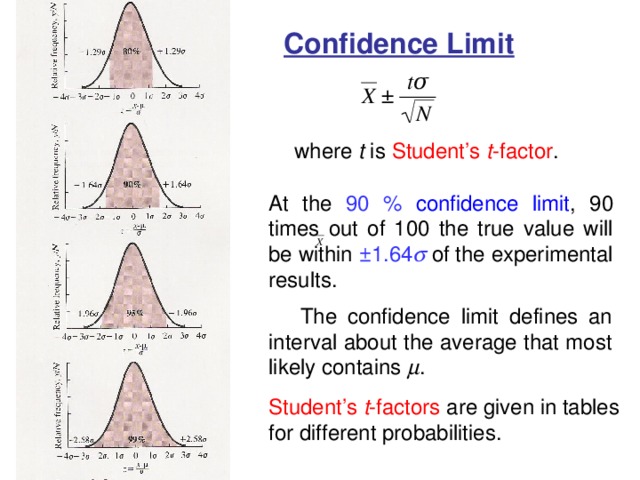
Confidence Limit
where t is Student’s t -factor .
At the 90 % confidence limit , 90 times out of 100 the true value will be within ±1.64 of the experimental results.
The confidence limit defines an interval about the average that most likely contains .
Student’s t -factors are given in tables for different probabilities.
Significant Figures
All non-zero digits are significant , for example, 123 has three significant figures .
Zeros between non-zero digits are significant , for example, 12.507 has five significant figures .
Zeros to the left of the first non-zero digit are not significant , for example, 1.02 has three significant figures, 0.12 has two significant figures, and 0.012 also has two significant figures.
If a number ends in zeros to the right of the decimal point, those zeros are significant , for example, 2.0 has two significant figures and 2.00 has three significant figures.
Throughout Chemistry 2, the proper number of significant figures must be used in all laboratory reports and on all examinations .
Failure to do so will result in the loss of credit.
Calculations Using Significant Figures
Significant figures in additions and subtractions
Decimal places are overwriting the significant figure rule. The answer should have the same number of decimal places as the quantity with the least decimal places. For Example,
3.7 m + 9.40 m = 13.1 m
2.35 L + 1.2 L = 3.6 L
3.67 kg + 12.498 kg = 16.17 kg
Significant figures in multiplications and divisions
The product or quotient should have the same number of significant digits as the quantity with least significant figures. For Example,
(0.023 m) x (3.40 m) = 0.078 m2
56.90 s / 2.45 s = 23.2
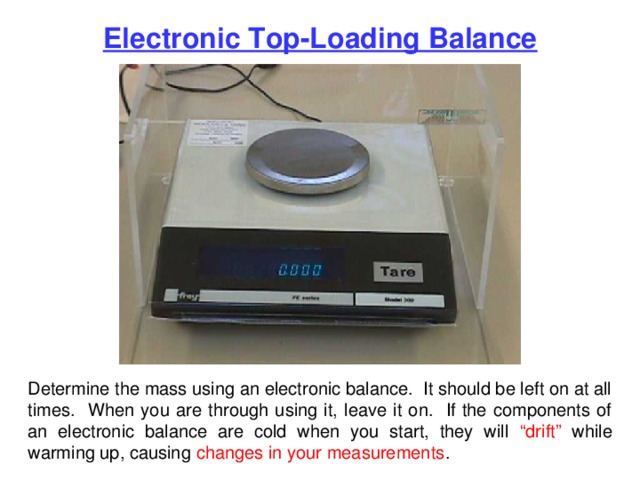
Electronic Top-Loading Balance
Determine the mass using an electronic balance. It should be left on at all times. When you are through using it, leave it on. If the components of an electronic balance are cold when you start, they will “drift” while warming up, causing changes in your measurements .
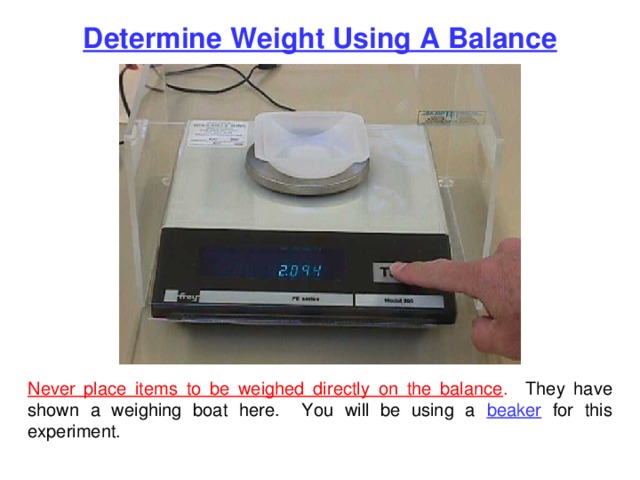
Determine Weight Using A Balance
Never place items to be weighed directly on the balance . They have shown a weighing boat here. You will be using a beaker for this experiment.
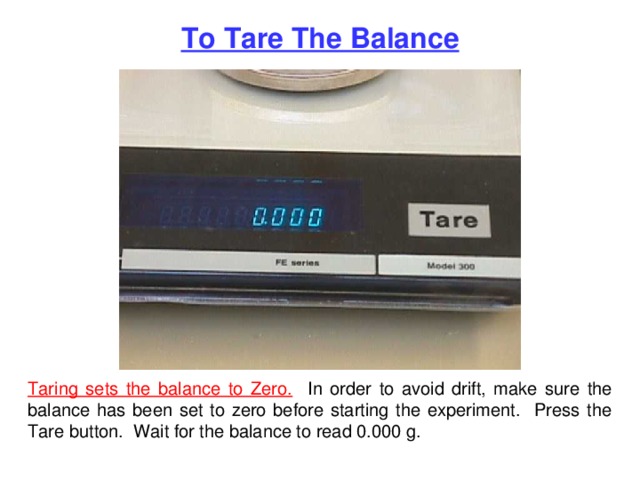
To Tare The Balance
Taring sets the balance to Zero. In order to avoid drift, make sure the balance has been set to zero before starting the experiment. Press the Tare button. Wait for the balance to read 0.000 g.
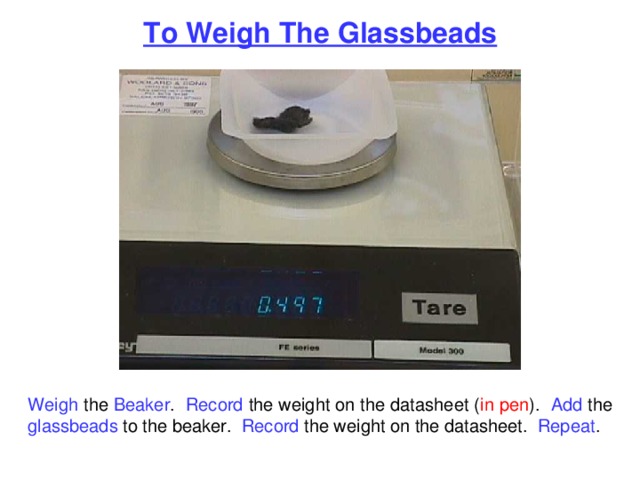
To Weigh The Glassbeads
Weigh the Beaker . Record the weight on the datasheet ( in pen ). Add the glassbeads to the beaker. Record the weight on the datasheet. Repeat .
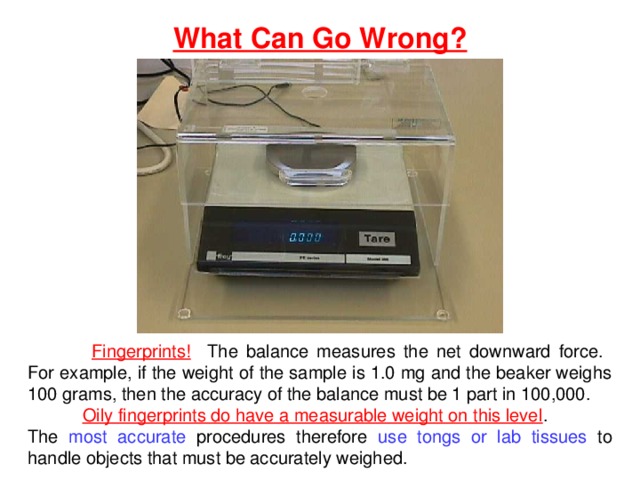
What Can Go Wrong?
Fingerprints! The balance measures the net downward force. For example, if the weight of the sample is 1.0 mg and the beaker weighs 100 grams, then the accuracy of the balance must be 1 part in 100,000.
Oily fingerprints do have a measurable weight on this level .
The most accurate procedures therefore use tongs or lab tissues to handle objects that must be accurately weighed.
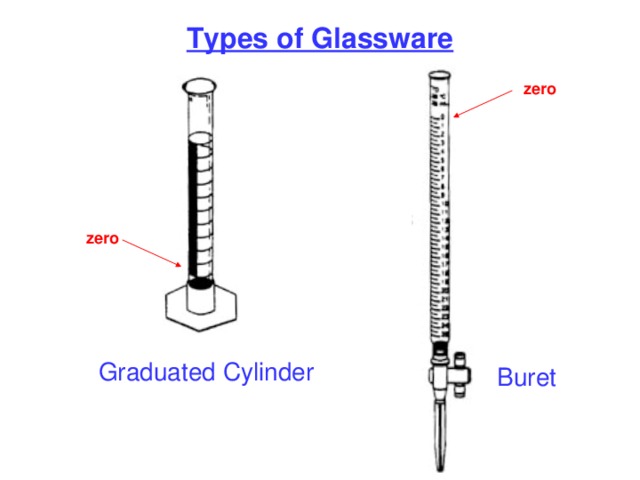
Types of Glassware
zero
zero
Graduated Cylinder
Buret
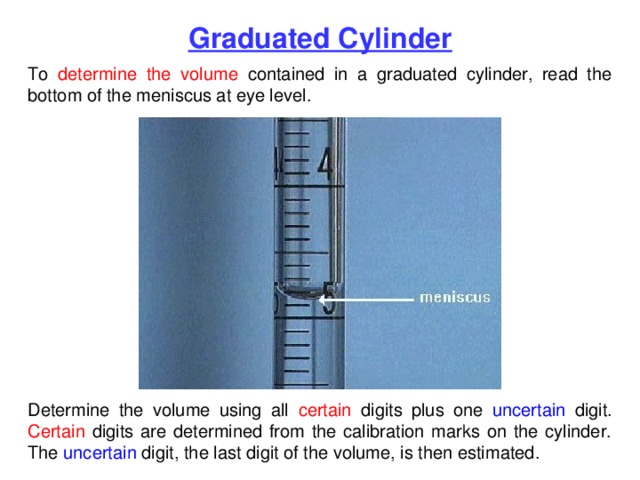
Graduated Cylinder
To determine the volume contained in a graduated cylinder, read the bottom of the meniscus at eye level.
Determine the volume using all certain digits plus one uncertain digit. Certain digits are determined from the calibration marks on the cylinder. The uncertain digit, the last digit of the volume, is then estimated.
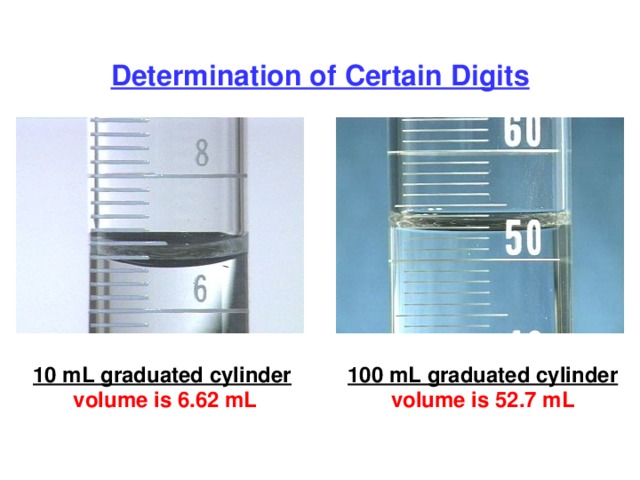
Determination of Certain Digits
10 mL graduated cylinder
100 mL graduated cylinder
volume is 6.62 mL
volume is 52.7 mL
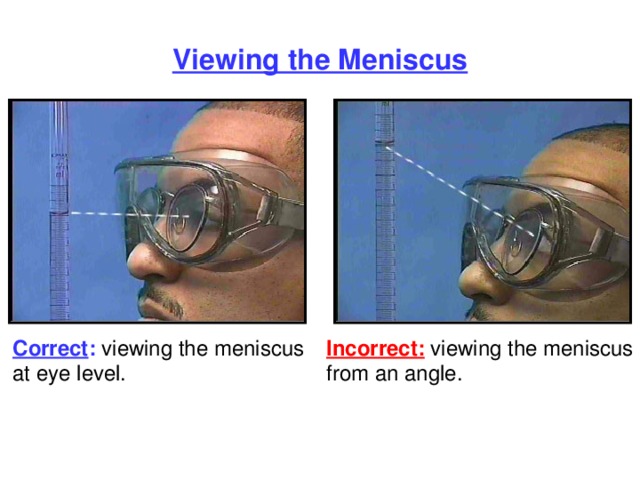
Viewing the Meniscus
Correct : viewing the meniscus at eye level.
Incorrect: viewing the meniscus from an angle.
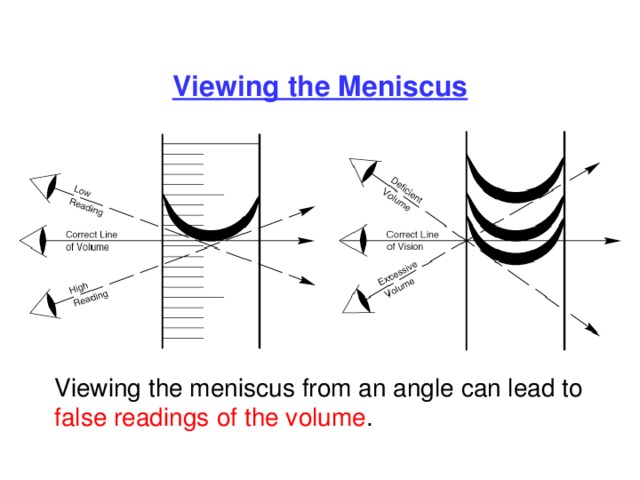
Viewing the Meniscus
Viewing the meniscus from an angle can lead to false readings of the volume .
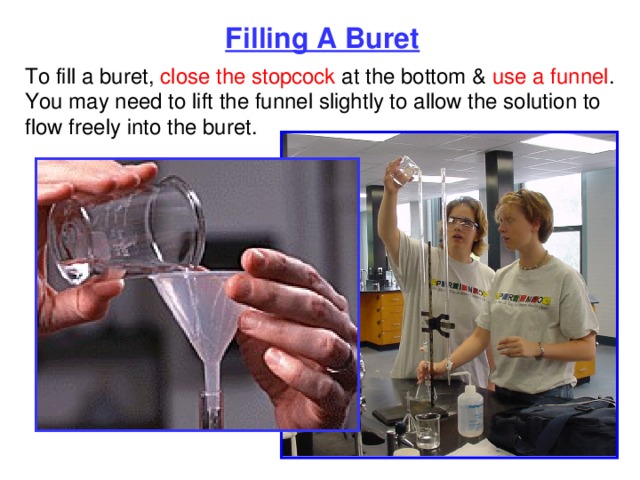
Filling A Buret
To fill a buret, close the stopcock at the bottom & use a funnel .
You may need to lift the funnel slightly to allow the solution to flow freely into the buret.
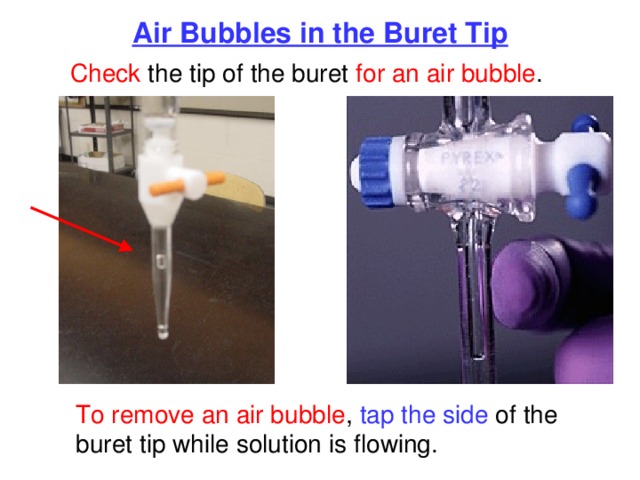
Air Bubbles in the Buret Tip
Check the tip of the buret for an air bubble .
To remove an air bubble , tap the side of the buret tip while solution is flowing.
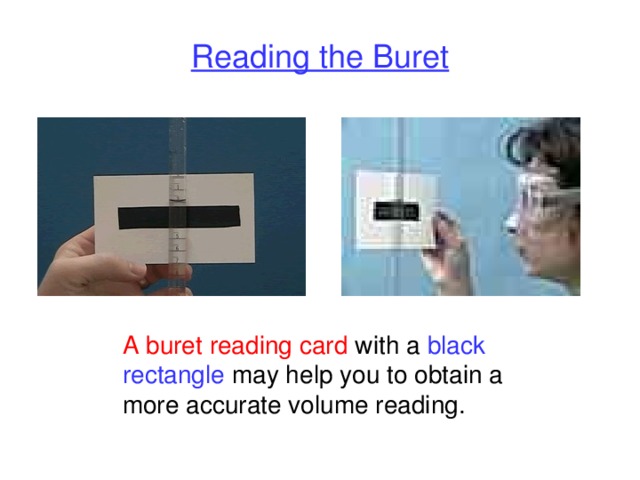
Reading the Buret
A buret reading card with a black rectangle may help you to obtain a
more accurate volume reading.
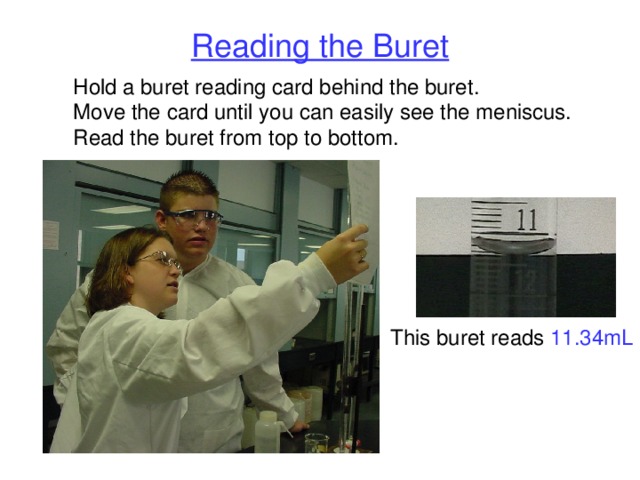
Reading the Buret
Hold a buret reading card behind the buret.
Move the card until you can easily see the meniscus.
Read the buret from top to bottom.
This buret reads 11.34mL
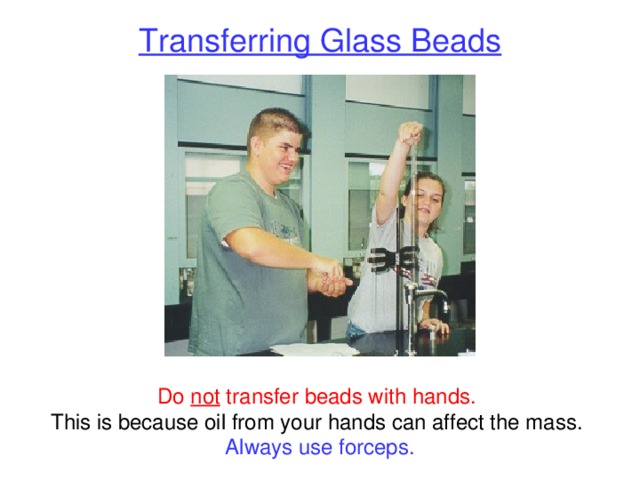
Transferring Glass Beads
Do not transfer beads with hands.
This is because oil from your hands can affect the mass.
Always use forceps.
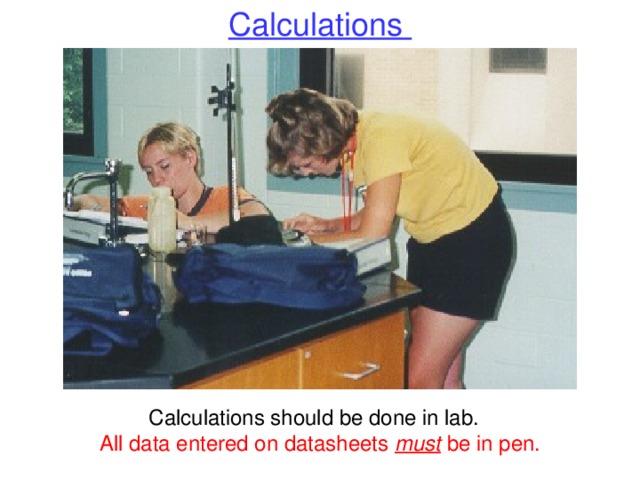
Calculations
Calculations should be done in lab.
All data entered on datasheets must be in pen.
Computer Simulation
Purpose of the Experiment
This experiment allows the measurements of the volumes and masses of randomly-selected groups of glass beads . These beads :
1. vary considerably in size
2. are not perfectly spherical
3. are limited to a range of diameters,
but vary appreciably in weight and volume
Directions for the computer simulation are located on your lab bench.


 Density-is a characteristic property of matter. (1.81 MB)
 0
0 562
562 2
2 Нравится
0
Нравится
0


